For Deal Sources
A unique solution for your client
Working together for over 25 years, we provide innovative private equity solutions to successful founders and entrepreneurs.
Investment Criteria
We invest behind dynamic entrepreneurs and founders that are seeking a partner for growth
Transaction Type
– Private IPO®
– Management Buyout
– Growth Equity
Platform EBITDA
$4 – $30MM+
Equity Investment
$20 – $100MM+

Business Services
Business Services
- Business Process Outsourcing
- Education
- Facility Management
- Food & Beverage Services
- Human Capital Management
- Industrial Services
- IT Services
- Marketing & Media Services
- Professional & Consulting Services
- Value-Added Distribution

Healthcare
Healthcare
- Ambulance & Patient Logistics
- Behavioral Health
- Consulting, Coding, Billing & RCM
- Home Health & Hospice
- Medical Technology & Healthcare Equipment
- Outsourced Medical Services
- Pharma Services

Manufacturing
Manufacturing
- Aerospace & Defense
- Chemicals
- Electrical Equipment & Components
- Food & Beverage Products and Processing Equipment
- Industrial & Aftermarket Components
- Packaging & Plastics
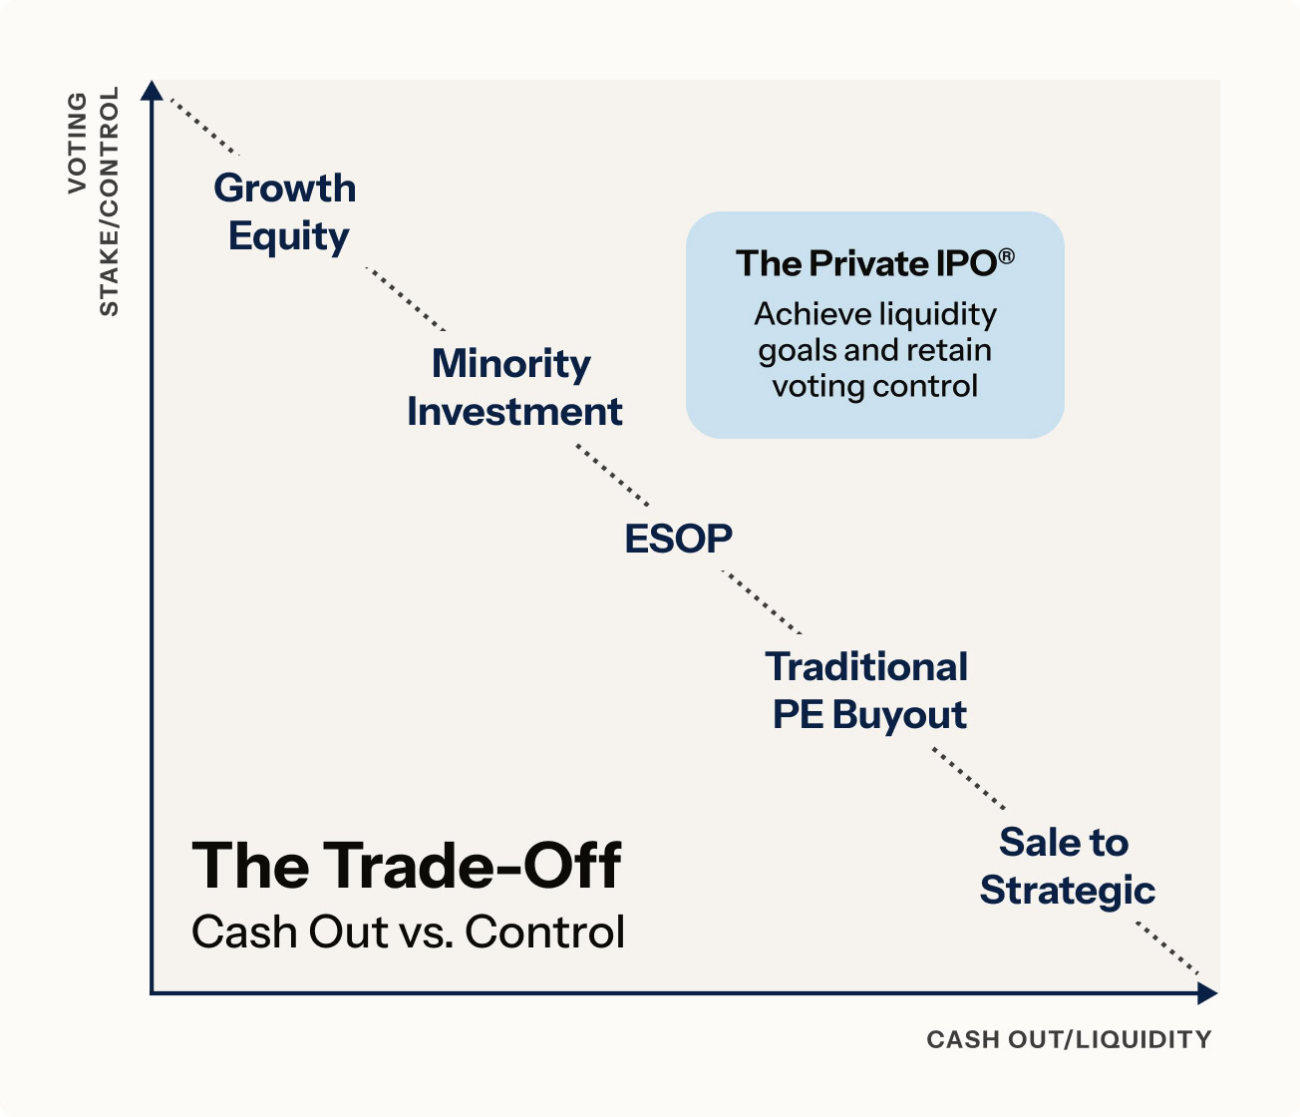
The Trade Off
The Private IPO® does not require the traditional trade-off between cash and control
Our unique transaction structure breaks the mold of balancing cash and control when taking on a capital partner.
The Private IPO is intentionally designed to address the liquidity objectives of business owners, while offering the ability to maintain control and capture future upside.
The Private IPO®
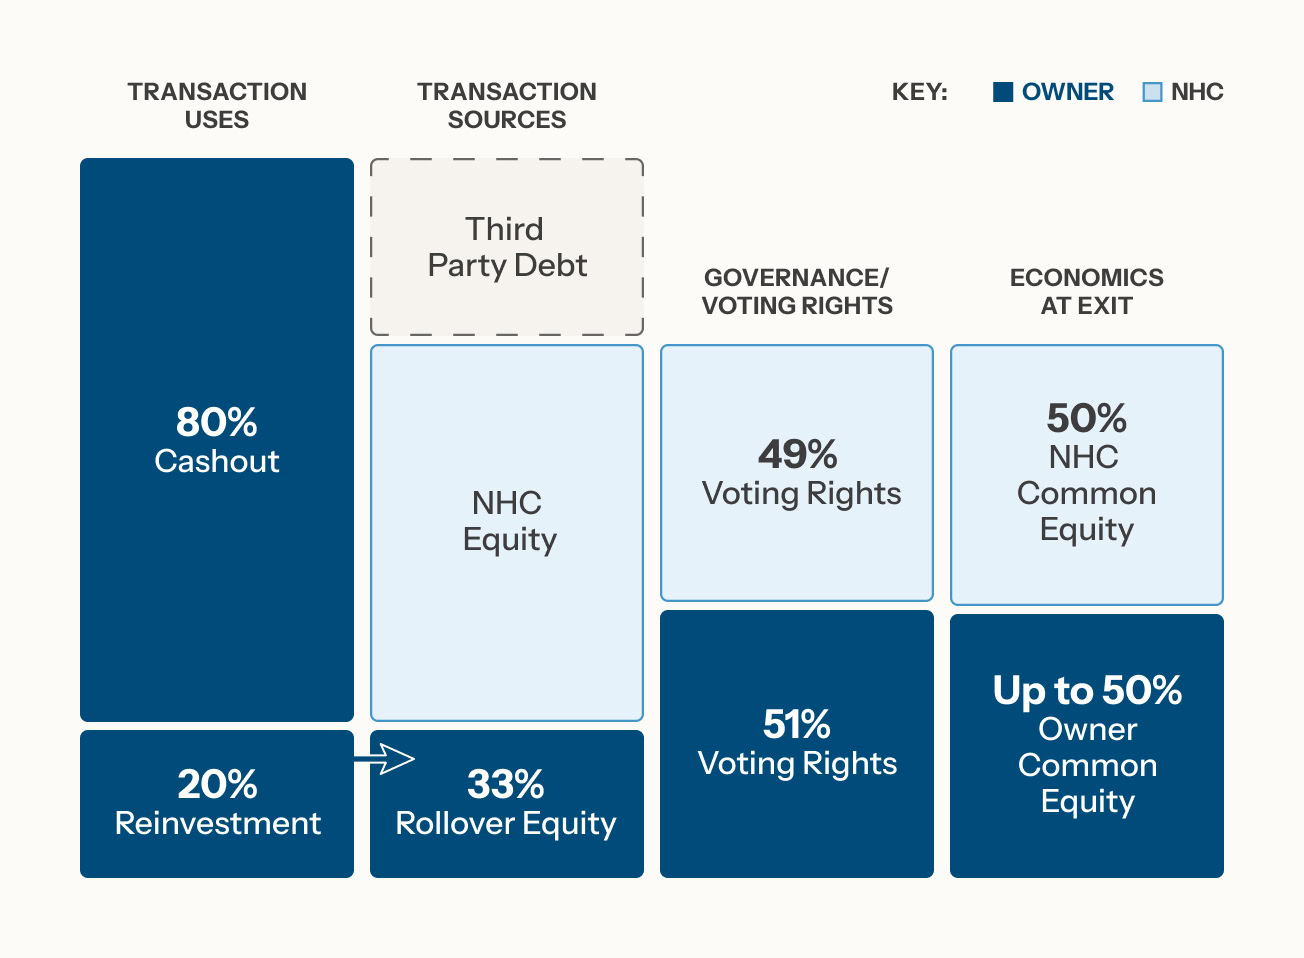
Breaking down the Private IPO®
Founders can uniquely achieve 80% liquidity, 51% control, and up to 50% ownership at exit.
Shareholders achieve their liquidity objectives, receiving up to 80% of Enterprise Value (EV) at closing.
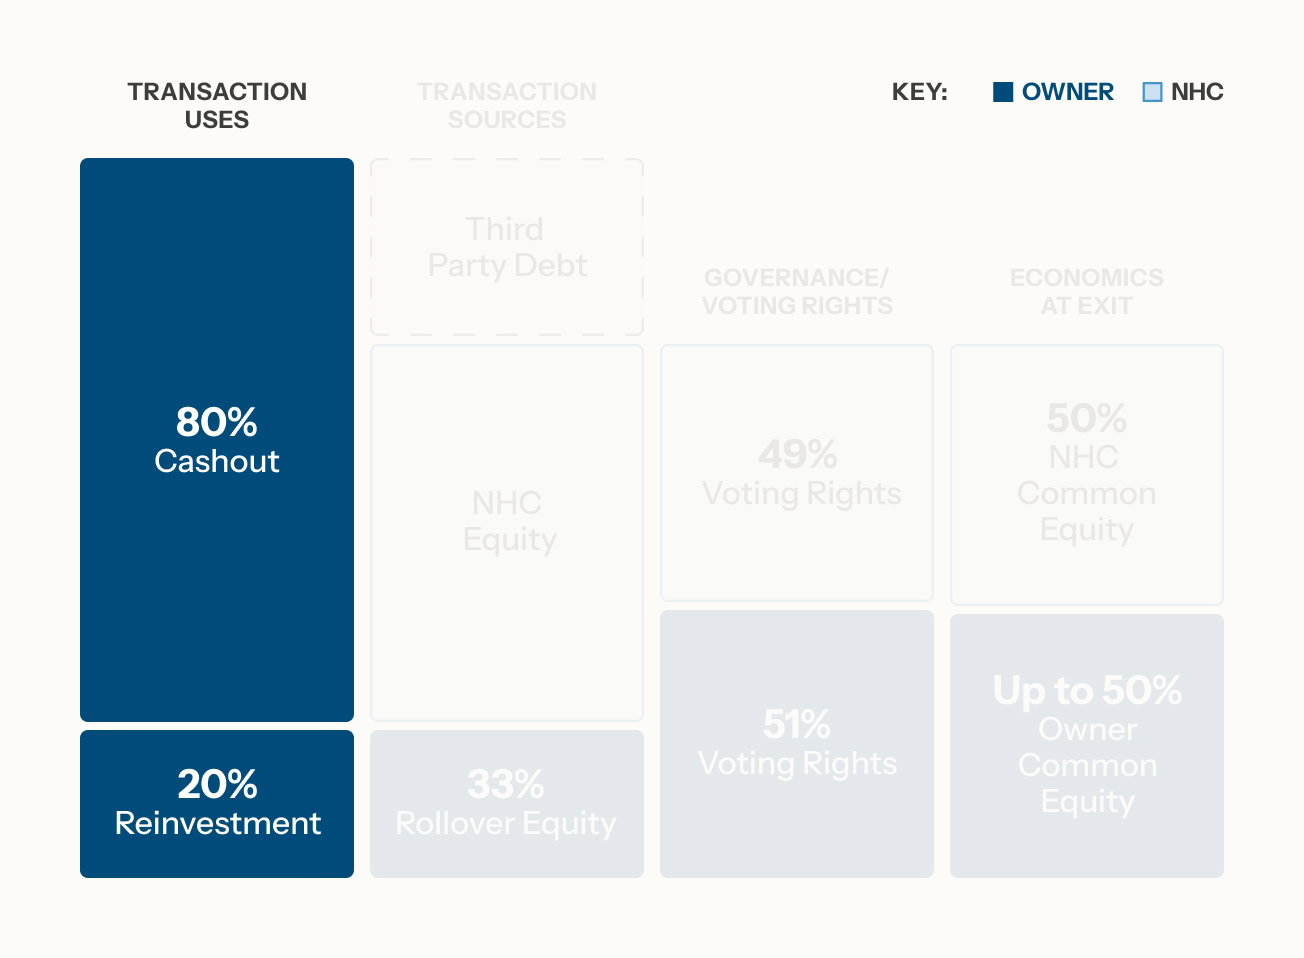
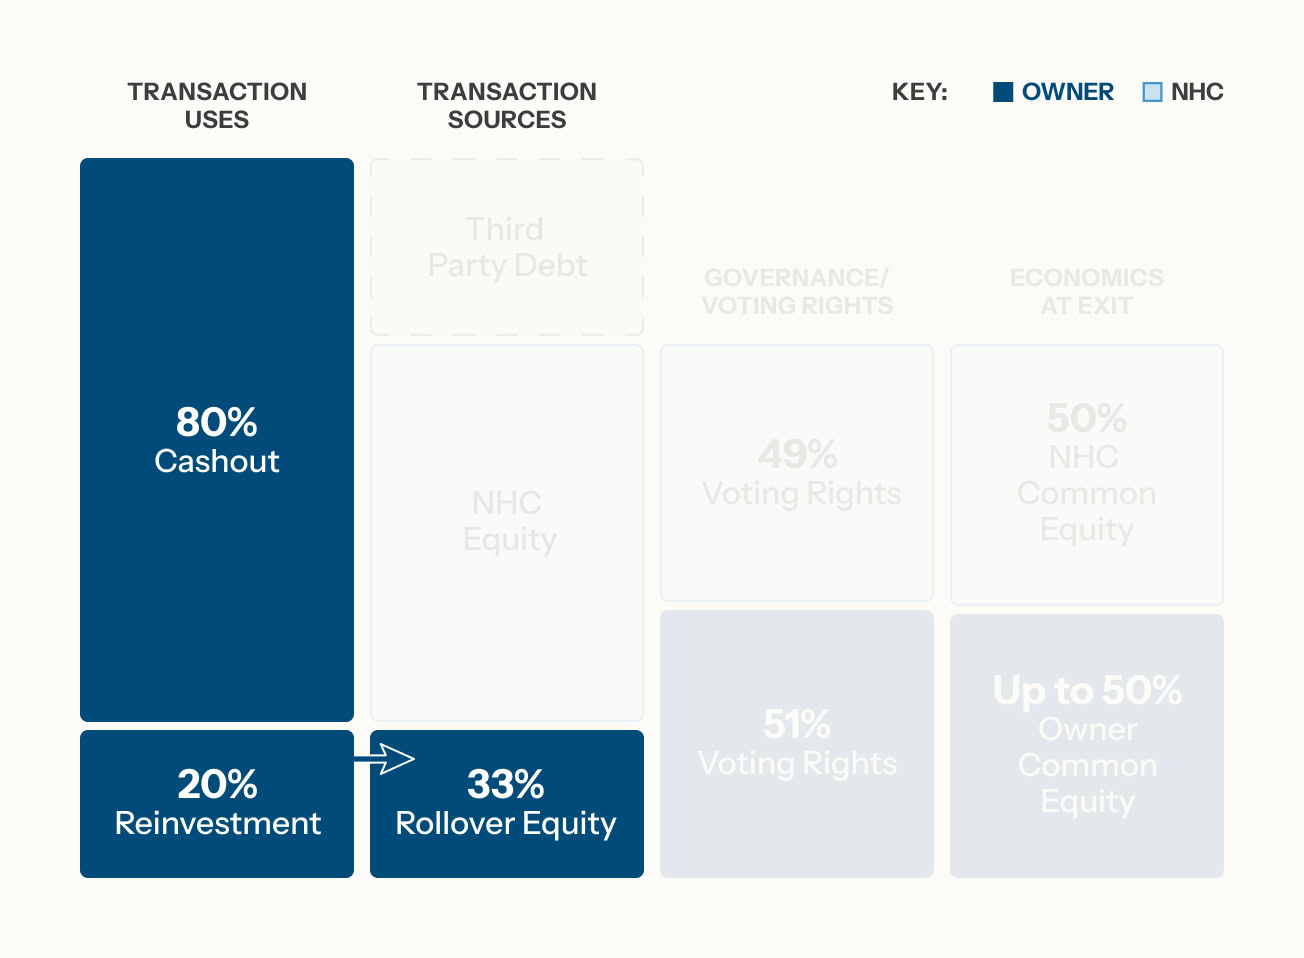
Shareholders roll over 20% of total proceeds into the deal for 33% of total invested equity.
In addition to raising third party debt, New Heritage invests 67% of the equity, half in common, pari-passu with owner’s reinvestment, and half in preferred with a 10% PIK paid at exit.
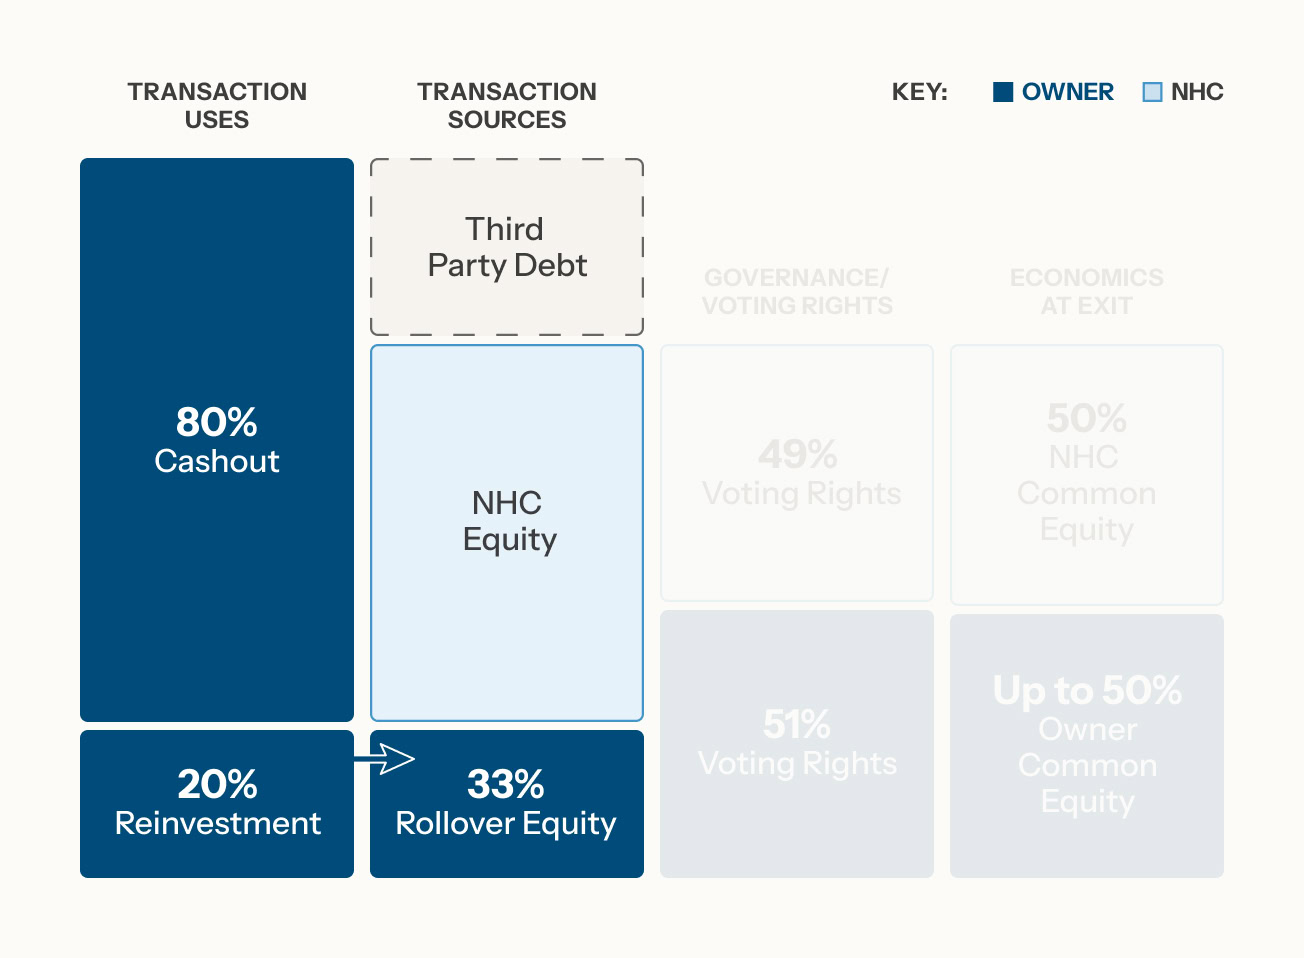
While New Heritage invests 67% of the equity, owners retain 51% of voting control subject to protective rights typically seen in joint venture structures.
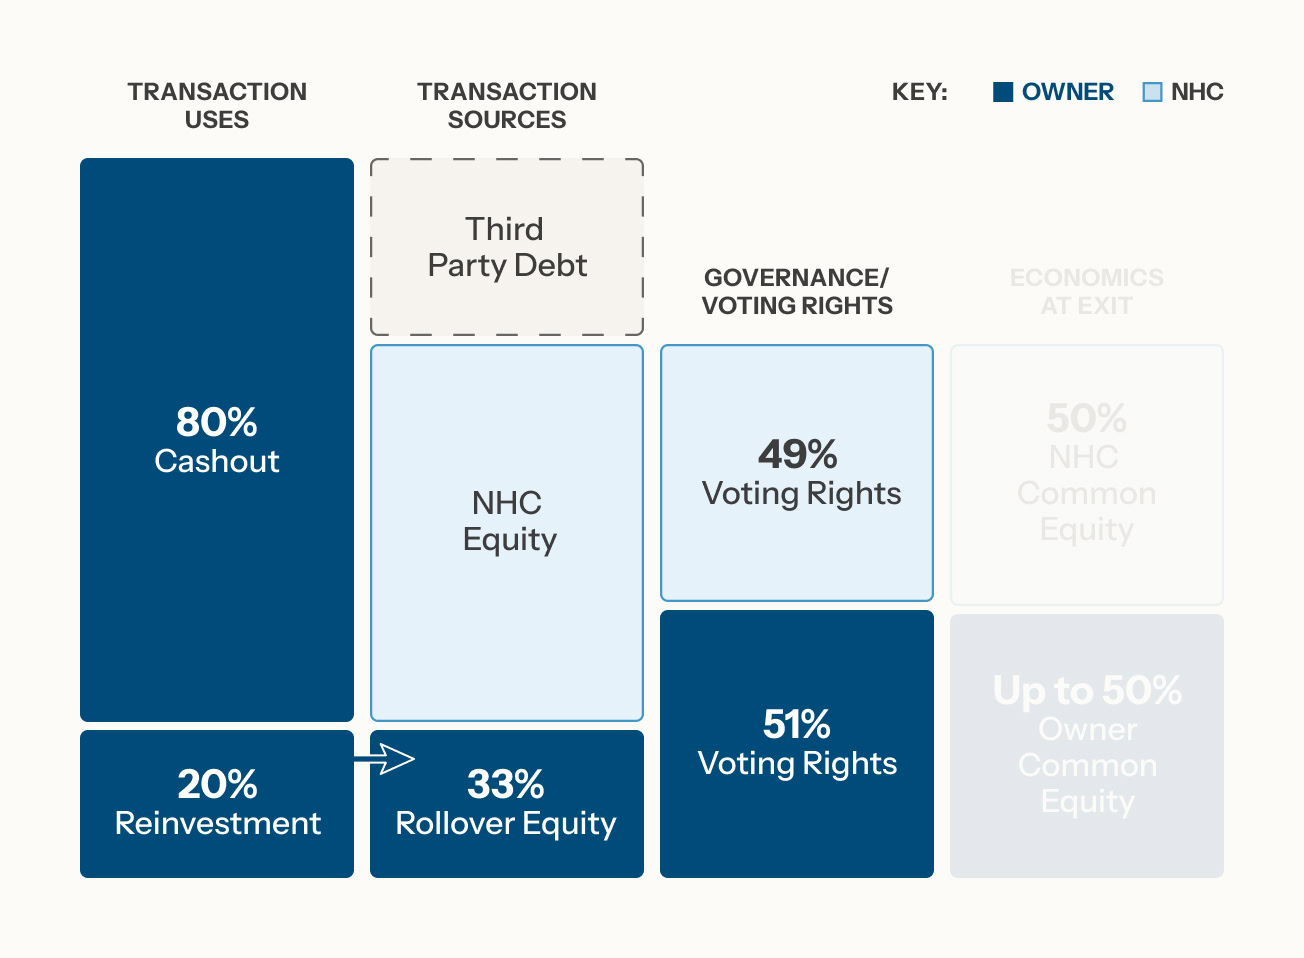
A 25% incentive equity pool enables owners to achieve up to 50% of the common equity at the next liquidity event after repayment of debt and preferred equity.